
Population growth in France
From 1960 to 2022 the population of France increased from 46.62 million to 67.97 million people. This is a growth of 45.8 percent in 62 years. The highest increase in France was recorded in 1963 with 1.41 percent. The smallest increase in 2016 with 0.26 percent.In the same period, the total population of all countries worldwide increased by 162.2 percent.
The average age in France rose by 1.97 years from 2012 to 2023 from 40.43 to 42.40 years (median value).
Around 82 percent of the inhabitants live in the country's larger cities. This growing trend of urbanization is increasing by 0.6 percent annually.
› Population growth in worldwide comparison
Back to overview: France
Population development in France since 1960
(Data in millions of inhabitants)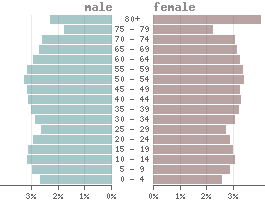 Historically, France has always been characterized by relatively stable population growth. Although the birth rate has been falling steadily since the 1960s, it has been higher than the death rate throughout the period. This is largely due to the general increase in life expectancy. Currently, life expectancy for men is 79.3 years and for women 85.5, and the mortality rate has only risen slightly in recent years.
The population pyramid shows that the age distribution is largely the same in almost all age groups. The problem of an aging population thus arises in France to a considerably lesser extent than in Germany, for example.
Another important factor for population growth in France is immigration. The country has a long tradition of welcoming immigrants from various parts of the world - in particular, there is a bond with the former French colonies. However, with about 8.52 million immigrants (i.e., people born outside France), the proportion in France is comparatively moderate. This is 12.5 percent of the total population.
Annual growth rates in percent
On average, 2.2 people live together per household in France.| Year | Population France | Change France | Birth rate | Death rate | Population World | Change World | |
|---|---|---|---|---|---|---|---|
| 1961 | 47.24 M | 1.33 % | 18.7 ‰ | 11.3 ‰ | 3,072 M | 1.30 % | |
| 1962 | 47.90 M | 1.41 % | 18.6 ‰ | 11.2 ‰ | 3,125 M | 1.72 % | |
| 1963 | 48.58 M | 1.41 % | 18.5 ‰ | 11.1 ‰ | 3,190 M | 2.08 % | |
| 1964 | 49.23 M | 1.33 % | 18.4 ‰ | 11.1 ‰ | 3,255 M | 2.05 % | |
| 1965 | 49.82 M | 1.19 % | 18.2 ‰ | 11.1 ‰ | 3,322 M | 2.06 % | |
| 1966 | 50.33 M | 1.03 % | 18.0 ‰ | 11.0 ‰ | 3,392 M | 2.11 % | |
| 1967 | 50.78 M | 0.89 % | 17.7 ‰ | 11.0 ‰ | 3,462 M | 2.05 % | |
| 1968 | 51.18 M | 0.79 % | 17.5 ‰ | 10.9 ‰ | 3,533 M | 2.06 % | |
| 1969 | 51.56 M | 0.75 % | 17.3 ‰ | 10.9 ‰ | 3,607 M | 2.09 % | |
| 1970 | 51.96 M | 0.77 % | 17.0 ‰ | 10.8 ‰ | 3,682 M | 2.09 % | |
| 1971 | 52.37 M | 0.80 % | 16.7 ‰ | 10.8 ‰ | 3,761 M | 2.13 % | |
| 1972 | 52.79 M | 0.81 % | 16.3 ‰ | 10.7 ‰ | 3,837 M | 2.03 % | |
| 1973 | 53.21 M | 0.79 % | 15.9 ‰ | 10.6 ‰ | 3,913 M | 1.98 % | |
| 1974 | 53.59 M | 0.72 % | 15.5 ‰ | 10.5 ‰ | 3,988 M | 1.93 % | |
| 1975 | 53.93 M | 0.63 % | 15.0 ‰ | 10.4 ‰ | 4,063 M | 1.86 % | |
| 1976 | 54.22 M | 0.54 % | 14.6 ‰ | 10.4 ‰ | 4,135 M | 1.80 % | |
| 1977 | 54.47 M | 0.46 % | 14.3 ‰ | 10.3 ‰ | 4,208 M | 1.75 % | |
| 1978 | 54.69 M | 0.41 % | 14.1 ‰ | 10.2 ‰ | 4,281 M | 1.75 % | |
| 1979 | 54.92 M | 0.41 % | 14.0 ‰ | 10.2 ‰ | 4,357 M | 1.76 % | |
| 1980 | 55.16 M | 0.45 % | 14.0 ‰ | 10.2 ‰ | 4,433 M | 1.75 % | |
| 1981 | 55.43 M | 0.49 % | 14.1 ‰ | 10.1 ‰ | 4,511 M | 1.76 % | |
| 1982 | 55.72 M | 0.52 % | 14.2 ‰ | 10.0 ‰ | 4,592 M | 1.80 % | |
| 1983 | 56.02 M | 0.55 % | 14.2 ‰ | 10.0 ‰ | 4,674 M | 1.78 % | |
| 1984 | 56.34 M | 0.56 % | 14.3 ‰ | 9.9 ‰ | 4,756 M | 1.75 % | |
| 1985 | 56.65 M | 0.56 % | 14.2 ‰ | 9.8 ‰ | 4,839 M | 1.75 % | |
| 1986 | 56.98 M | 0.57 % | 14.1 ‰ | 9.7 ‰ | 4,925 M | 1.77 % | |
| 1987 | 57.30 M | 0.57 % | 14.0 ‰ | 9.6 ‰ | 5,013 M | 1.78 % | |
| 1988 | 57.63 M | 0.57 % | 13.8 ‰ | 9.5 ‰ | 5,101 M | 1.77 % | |
| 1989 | 57.94 M | 0.54 % | 13.6 ‰ | 9.4 ‰ | 5,190 M | 1.74 % | |
| 1990 | 58.24 M | 0.51 % | 13.4 ‰ | 9.3 ‰ | 5,280 M | 1.74 % | |
| 1991 | 58.56 M | 0.56 % | 13.2 ‰ | 9.2 ‰ | 5,368 M | 1.67 % | |
| 1992 | 58.85 M | 0.50 % | 13.1 ‰ | 9.2 ‰ | 5,453 M | 1.57 % | |
| 1993 | 59.11 M | 0.43 % | 13.0 ‰ | 9.2 ‰ | 5,538 M | 1.56 % | |
| 1994 | 59.33 M | 0.37 % | 12.5 ‰ | 9.1 ‰ | 5,622 M | 1.52 % | |
| 1995 | 59.54 M | 0.36 % | 12.8 ‰ | 9.1 ‰ | 5,707 M | 1.51 % | |
| 1996 | 59.75 M | 0.35 % | 12.8 ‰ | 9.1 ‰ | 5,790 M | 1.45 % | |
| 1997 | 59.96 M | 0.35 % | 12.7 ‰ | 9.1 ‰ | 5,872 M | 1.43 % | |
| 1998 | 60.19 M | 0.37 % | 12.8 ‰ | 9.1 ‰ | 5,954 M | 1.39 % | |
| 1999 | 60.50 M | 0.52 % | 12.9 ‰ | 9.1 ‰ | 6,034 M | 1.35 % | |
| 2000 | 60.91 M | 0.69 % | 13.3 ‰ | 8.9 ‰ | 6,114 M | 1.32 % | |
| 2001 | 61.36 M | 0.73 % | 13.1 ‰ | 8.8 ‰ | 6,194 M | 1.30 % | |
| 2002 | 61.81 M | 0.73 % | 12.9 ‰ | 8.8 ‰ | 6,273 M | 1.28 % | |
| 2003 | 62.24 M | 0.71 % | 12.8 ‰ | 9.1 ‰ | 6,352 M | 1.26 % | |
| 2004 | 62.70 M | 0.74 % | 12.8 ‰ | 8.3 ‰ | 6,432 M | 1.25 % | |
| 2005 | 63.18 M | 0.76 % | 12.8 ‰ | 8.5 ‰ | 6,512 M | 1.25 % | |
| 2006 | 63.62 M | 0.70 % | 13.1 ‰ | 8.3 ‰ | 6,593 M | 1.24 % | |
| 2007 | 64.02 M | 0.62 % | 12.8 ‰ | 8.3 ‰ | 6,674 M | 1.24 % | |
| 2008 | 64.37 M | 0.56 % | 12.9 ‰ | 8.5 ‰ | 6,757 M | 1.24 % | |
| 2009 | 64.71 M | 0.52 % | 12.8 ‰ | 8.5 ‰ | 6,840 M | 1.22 % | |
| 2010 | 65.03 M | 0.50 % | 12.9 ‰ | 8.5 ‰ | 6,922 M | 1.20 % | |
| 2011 | 65.34 M | 0.48 % | 12.7 ‰ | 8.4 ‰ | 7,004 M | 1.18 % | |
| 2012 | 65.66 M | 0.49 % | 12.6 ‰ | 8.7 ‰ | 7,089 M | 1.22 % | |
| 2013 | 66.00 M | 0.52 % | 12.4 ‰ | 8.7 ‰ | 7,176 M | 1.22 % | |
| 2014 | 66.31 M | 0.47 % | 12.4 ‰ | 8.4 ‰ | 7,262 M | 1.20 % | |
| 2015 | 66.55 M | 0.36 % | 12.0 ‰ | 8.9 ‰ | 7,405 M | 1.98 % | |
| 2016 | 66.72 M | 0.26 % | 11.8 ‰ | 8.9 ‰ | 7,492 M | 1.17 % | |
| 2017 | 66.92 M | 0.29 % | 11.5 ‰ | 9.1 ‰ | 7,576 M | 1.12 % | |
| 2018 | 67.16 M | 0.36 % | 11.3 ‰ | 9.1 ‰ | 7,660 M | 1.11 % | |
| 2019 | 67.39 M | 0.34 % | 11.2 ‰ | 9.1 ‰ | 7,742 M | 1.06 % | |
| 2020 | 67.57 M | 0.27 % | 10.9 ‰ | 9.9 ‰ | 7,820 M | 1.01 % | |
| 2021 | 67.76 M | 0.29 % | 10.9 ‰ | 9.7 ‰ | 7,888 M | 0.87 % | |
| 2022 | 67.97 M | 0.31 % | 7,951 M | 0.79 % |
Birth and death rate in France
Population growth is the result of the birth rate, the mortality rate and the migration rate. For example, the year 2021 in the graph: The population in France increased by about 193,000 inhabitants. In the same year, the death rate was 9.7 per 1,000 people (~ 655,000 deaths) and the birth rate was 10.9 per 1,000 people (~ 737,000 births). As a result, around 111,000 inhabitants have to be added by migration from other countries.Over the past 10 years, the number of average deaths per year was 604,817 in France. The number of births was 781,224 annually.
The changes in births and deaths is displayed in the following graph. All data refer to births or deaths per 1,000 inhabitants.
Birth rate Death rate Comparison of the global population density
 Quality of life 2024 in country comparison
 Development and importance of tourism for Italy