
Application of Failure Mode Effects Analysis for Maintenance of Turnout System on Serviced Urban Rapid Transit

1
Department of Construction Engineering, Dongyang University, No. 145 Dongyangdae-ro, Punggi-eup, Yeongju-si 36040, Republic of Korea
2
Department of Architectural Engineering, Gachon University, 1342 Seongnamdaero, Sujeong-gu, Seongnam-si 13120, Republic of Korea
3
Track Engineering Office 2, Seoul Metro, No. 5, Hyoryeong-ro, Seocho-gu, Seoul 06693, Republic of Korea
*
Author to whom correspondence should be addressed.
Appl. Sci. 2023, 13(5), 2978; https://doi.org/10.3390/app13052978
Submission received: 31 January 2023
/
Revised: 22 February 2023
/
Accepted: 23 February 2023
/
Published: 25 February 2023
Abstract
:Over the past 25 years, maintenance processes for the wooden sleeper turnouts of sleeper floating tracks (known as STEDEF) have been insufficient, lacking accurate maintenance history and failure cause analyses. Currently, damaged parts are repeatedly replaced without an analysis of the cause of their failure. Therefore, it has been difficult to predict potential damages due to the lack of maintenance history data on the replaced items and the timing of the turnout component. This study proposes a turnout maintenance plan using the failure mode and effects analysis (FMEA) technique to analyze the turnout maintenance history data for a period spanning 10 years. The maintenance damage type of the turnout was classified to confirm the cause of damage and the damage frequency. Additionally, components that could lower the occurrence score were selected based on a risk analysis of the turnover. Therefore, it was possible to reduce the risk occurrence score by improving the size of the turnout top plate and the number of bolts.
1. Introduction
Unlike gravel ballasts in railways, the turnout on the sleeper floating track (STEDEF) of urban railways is installed in the form of wooden sleepers on concrete ballasts. The difference in the track irregularity in the concrete ballast is small; however, as the number of trains increases, the turnout components become damaged due to increased fatigue. Furthermore, because of the deformation of the sleeper, turnout track irregularities occur, components (such as fasteners) are damaged, and the fastening force of the track decreases. As the number of in-service years increases, it is expected that the failure frequency and damage quantity of turnout systems will also increase. Therefore, to solve the problem of track maintenance in Korea, i.e., planned maintenance or post-maintenance, this study introduces the failure mode and effects analysis (FMEA) technique, which can enable preemptive preventive measures for turnout maintenance. Several studies have employed FMEA to determine solutions and proactive measures against these problems based on preventive maintenance. Kim [1] performed computer modeling based on the geometric shapes of an F10 turnout and conducted an analysis based on changes in the cross-sectional shapes of the switch and crossing panels to examine the effects on the improvement of running safety. Lim et al. applied an FMEA that satisfied the accident response perspective of a single-operator train driver and developed an emergency response system standard for risk assessment [2]. Choi et al. [3] proposed a method to combine an FMEA and a blueprint to ensure the reliability of the mechanical design process. The FMEA was used to develop a combined model capable of improved prioritization. Based on application case studies, it was confirmed that the reliability and quality were improved. Youn [4] created an FMEA sheet based on the derivation of risk factors and frequencies of occurrence for derailment accidents in the main line owing to track defects and recommended activities necessary for safety management. As a result, it was found that the importance value differed depending on the occurrence risk factor. It was confirmed that systematic safety management data could be established.
Shirvani et al. described a modeling approach to depict the hazards in transport systems such as heavy rails by utilizing SysML diagrams and FMEA [5]. Issad et al. presented an FMEA method based on the scenario oriented language (ScOLA) for railway systems to explore the failure scenarios for safety analysis and validated the proposed method [6]. Sitarz et al. demonstrated an application of FMEAs for risk assessment in the operation and safety monitoring of railway transport [7], which prevented and reduced railway accidents. The railway operating processes were improved by the FMEA. Wang et al. [8] established a reliability analysis method for a ballast cleaning device based on fuzzy fault tree analysis (FTA) and an FMEA using a normal, fuzzy, comprehensive evaluation method that combined both theoretical and expert considerations. The FMEA was then employed to analyze the key parts of the ballast cleaning device with appropriate maintenance measures applied depending on the specific failure reasons. The FMEA method was used to analyze the railway devices, and corresponding compensation measures were put forward according to the reasons for failure. Macura et al. conducted a risk analysis of the railway infrastructure of the Republic of Serbia using a fuzzy FMEA which resulted in interval type-2 fuzzy sets that addressed risk assessment uncertainties [9]. Fu et al. presented an extended FMEA model based on the type-2 intuitionistic fuzzy VIKOR method to assess railway transportation risks [10]. Márquez et al. developed a remote condition monitoring system approach algorithm to detect the gradual failure of railroad junctions, thus enabling a switch and crossing maintenance system. The Kalman filter improved the defect through process estimation using a form of feedback control [11]. Szkoda and Kaczor [12] conducted an FMEA analysis to evaluate the safety of railway vehicles. As a result, a systematic approach was established for all expected failure modes through FMEA. The reliability and efficiency of the product could be improved by considering consumer needs. Sitarz et al. [7] and Park et al. [13] applied an FMEA to evaluate the operational risks of railway transportation. Matusevych et al. applied the FMEA method for the continuous improvement of the repair system of railway substations [14]. Szmel and Wawrzyniak presented an application of the FMEA method related to the design verification of railway signaling systems and confirmed that no single failure mode of hardware components was hazardous when the FMEA method was applied [15]. Huang et al. used the FMEA-TIFIAD approach to identify the risk of railway systems that transport dangerous goods and found it to be more reliable than the FMEA method. In addition, improvement suggestions were provided for managers and operators [16]. Smoczyński and Kadziński [17] introduced a risk management method to integrate the processes of the railway track maintenance system of the European Union rail network with the safety management system of an infrastructure manager. In addition, risk management in relation to rail infrastructure and transport management in the European Union rail network is necessary for implementing safety policies. Several studies on risk management are being conducted abroad.
For the proper implementation of an FMEA, it is imperative to obtain long-term historical maintenance records for turnout systems. Additionally, it is necessary to ensure the reliability of long-term historical data based on continuous inspections and data collection and compilation in a consistent manner. Most previous studies on FMEA applications have been limited to the investigations of urban railway vehicles, automotive parts, and railway accidents; only a few studies adopted FMEA for maintaining turnout systems. This study analyzed the 10 years of historical maintenance records and on-site inspection results to analyze the failure mechanisms of urban railway turnout components. Based on the historical maintenance records, the occurrence (probability; P), sensitivity (S), and detection (D) of damage for each turnout component were derived, and the risk priority number (RPN) was calculated for quantitative analyses. Based on the calculated RPN scores, the components were ranked according to their vulnerability to damage. RPN groups were derived according to the ranking. In addition, the damage of the turnout was analyzed using the FMEA. In consideration of the damage frequency and risk of the components of the turnout, a plan to improve the maintenance of the turnout was proposed.
2. Analysis of the Characteristics and Current State of Turnout Systems in Urban Railways
2.1. Definition of Functions for Main Locations in Turnout System
As is shown in Figure 1, a turnout system is divided into a switch, closure, and crossing panels. On a railway, a switch panel is composed of a normal rail and switch toes, a closure panel is composed of a closure rail, and a crossing panel comprises crossing, check, and stock rails.
The switch panel, as the only component with movable rails, is where switch toes are installed for changing the running direction of the train; the location of the rail is frequently moved by a mechanical system. Subsequently, the closure panel guides the train to run in the direction set on the switch panel. Regarding the closure panel: although the horizontal alignment is curved, the cant is not set to balance the curve, resulting in considerable side-to-side vibrations of the train and generating a large centrifugal force.
Conversely, to enable trains to enter the through and diverging lines, a discontinuity zone inevitably exists with a partial discontinuation of the railway track. The nose of the crossing is also where the impact of the driving wheels is directly applied; hence, this is a vulnerable part frequently subjected to various types of damage. Additionally, the turnout system is a complex structure comprising rails and sleepers with diverse shapes. It includes rail joints used to connect different types of rails, as well as fastening systems and bolts for the connections between individual components.
Although a turnout system is subject to large and small damages, it is difficult to accurately identify the causes of damage considering that the system comprises various components. Therefore, it is important to understand the components that are subject to recurrent damage as well as the causes of the damage to conduct more efficient systematic maintenance of the components vulnerable to damage.
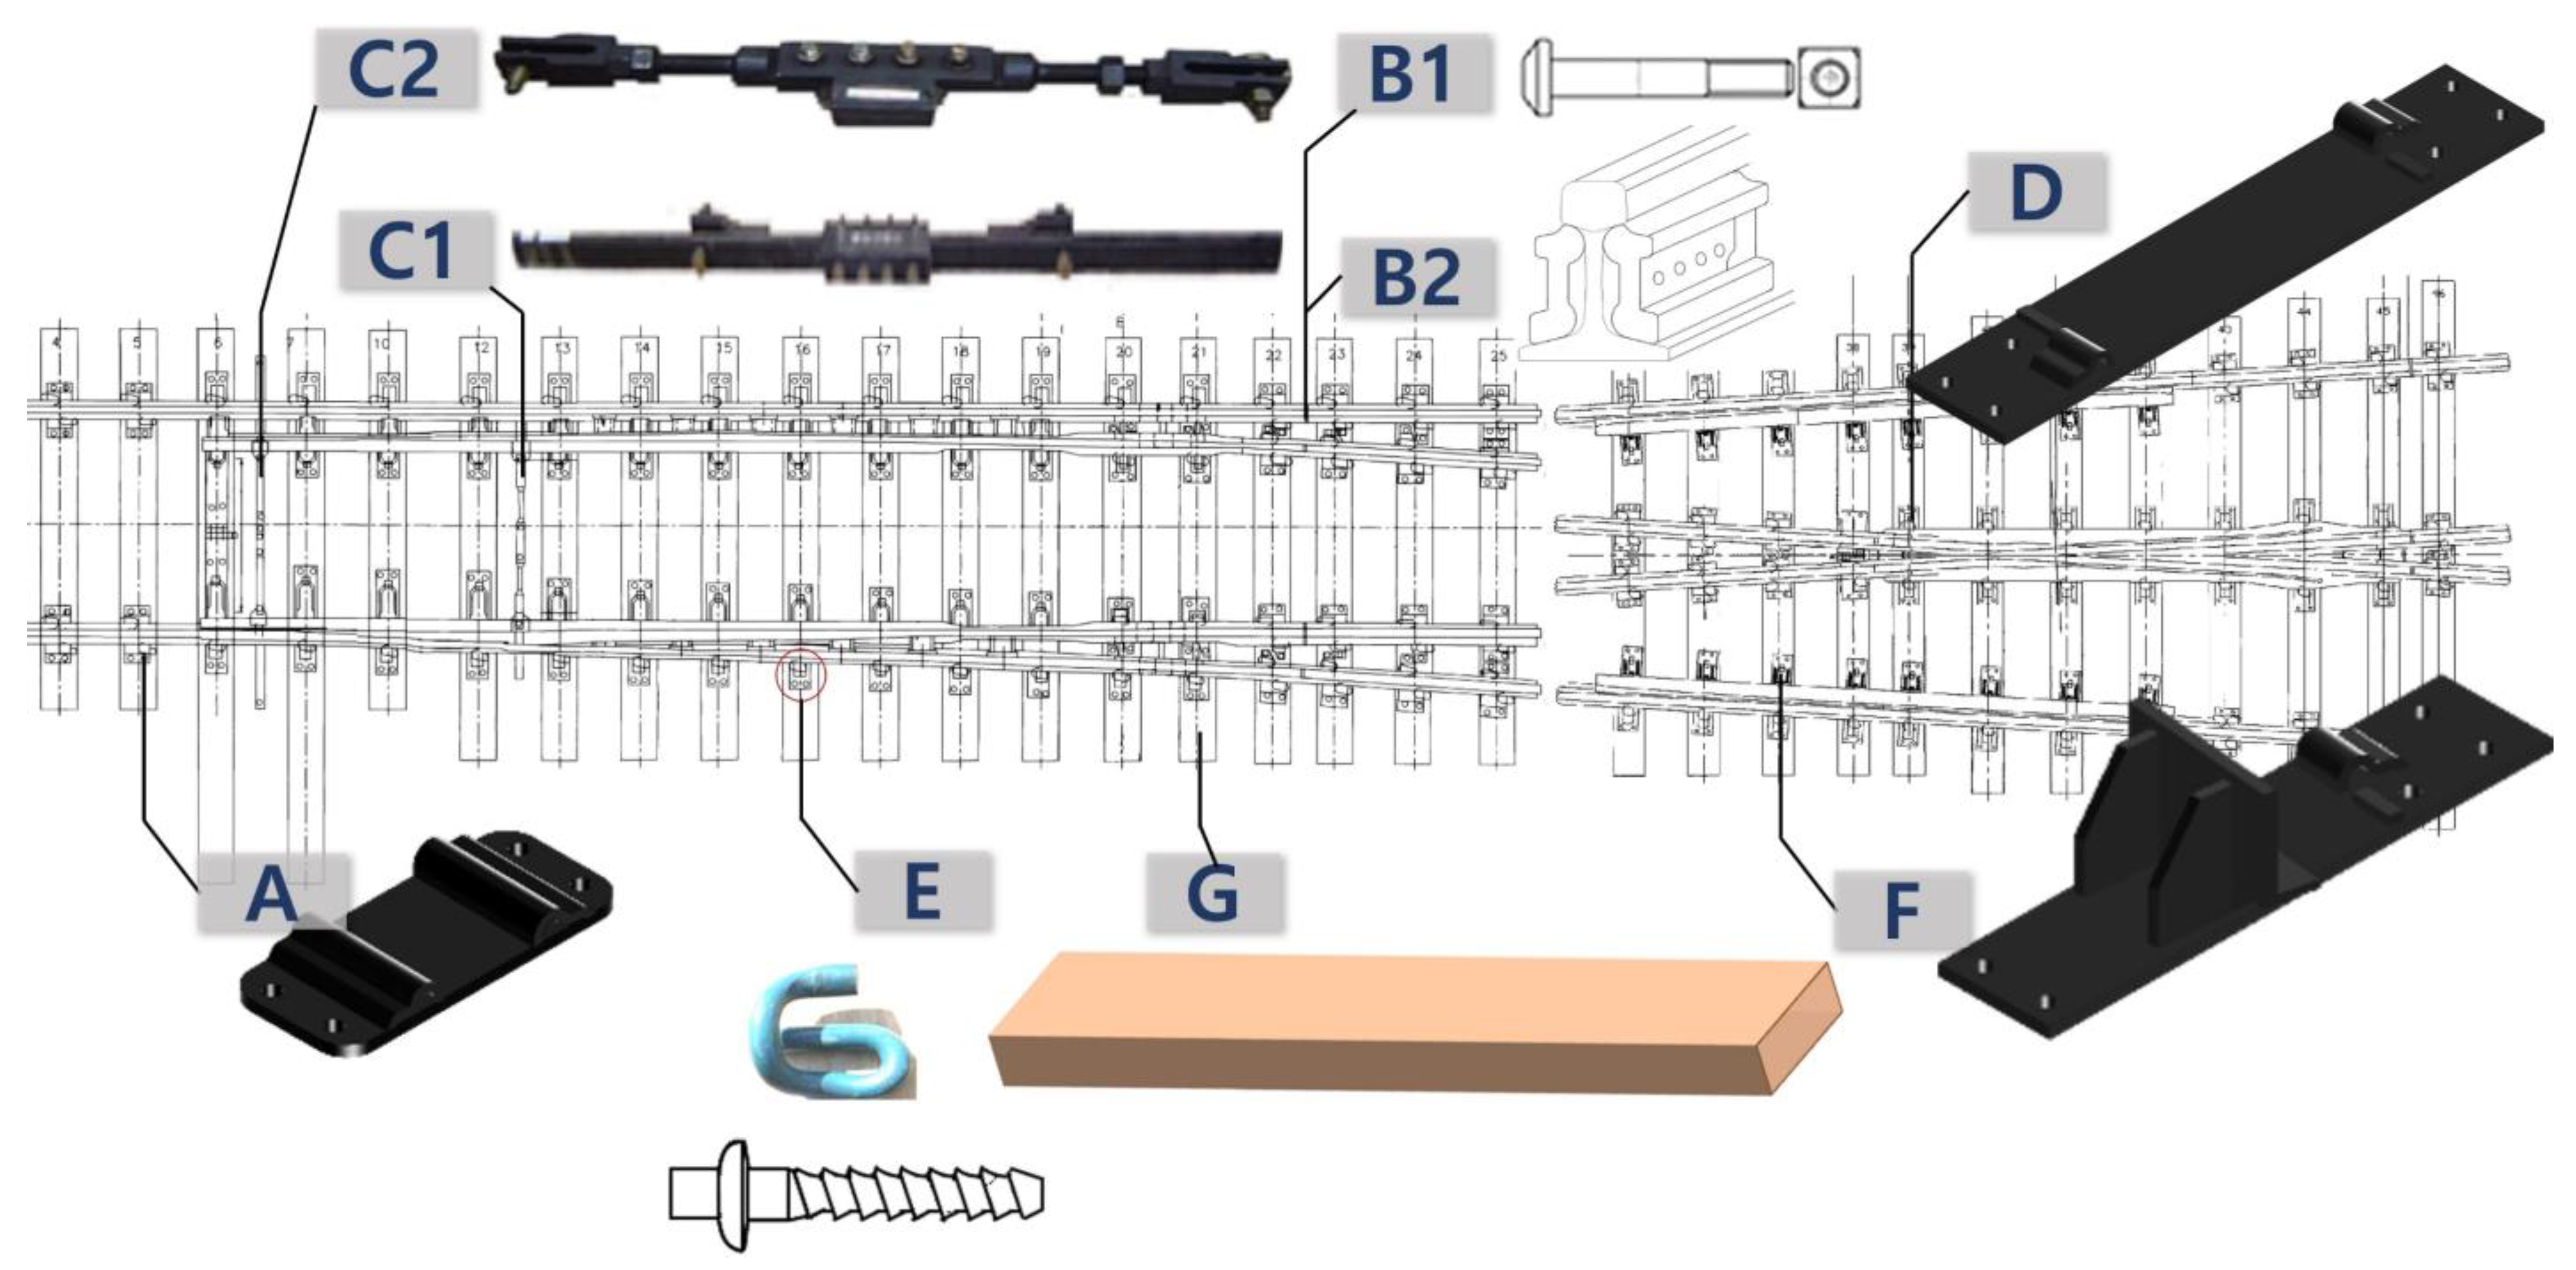
Figure 2 shows the typical non-rail components present in a turnout system. Note that A is the sole plate, B1 is the joint bolt, B2 is the joint plate, C1 and C2 are the stretcher bars, D is the crossing baseplate, E is the fastening component, F is the check rail bracket baseplate, and G is the sleeper.
The wooden sleeper turnout analyzed in this study is a turnout with a manganese steel crossing installed on a concrete roadbed. The turnout numbers are F8, F10, and F12. F is a check rail bracket baseplate which fixes the check rail bracket, as shown in Figure 2. The dimensions of F8, F10, and F12 are 180 × 371 mm, 180 × 360 mm, and 180 × 400 mm, respectively.
Considering the types of turnout systems installed on the concrete roadbed, shown in Figure 3, there are three types installed on the main lines of urban railways: crossover, double junction, and scissors.
2.2. Damage Status of Turnout Systems in Railway Service Lines
The main types of damage on the switch panels are wear, replacement, the breakage of switch toes, abnormal wear, rail-end worn out, partial fracture, and spalling. The status in terms of damage quantity is based on the turnout number; these numbers are equal to 14, 25, and 6 for F8, F10, and F12, respectively. F10 was the turnout in the main line that had the highest number of damage occurrences.
Non-optimal contact and the rolling contact fatigue damage of switch toes are shown in Figure 4a. Partial cracked damage to the switch toes is a type of damage that occurs when a wheel flange comes into contact with the sharp section of the switch toes due to the lateral vibrations that arise when a train passes through the turnout switch panel, resulting in local cracks. In addition, as shown in Figure 4b,c, abnormal wear was also observed locally, thereby depicting the rail surface at the location of the heel block installation.
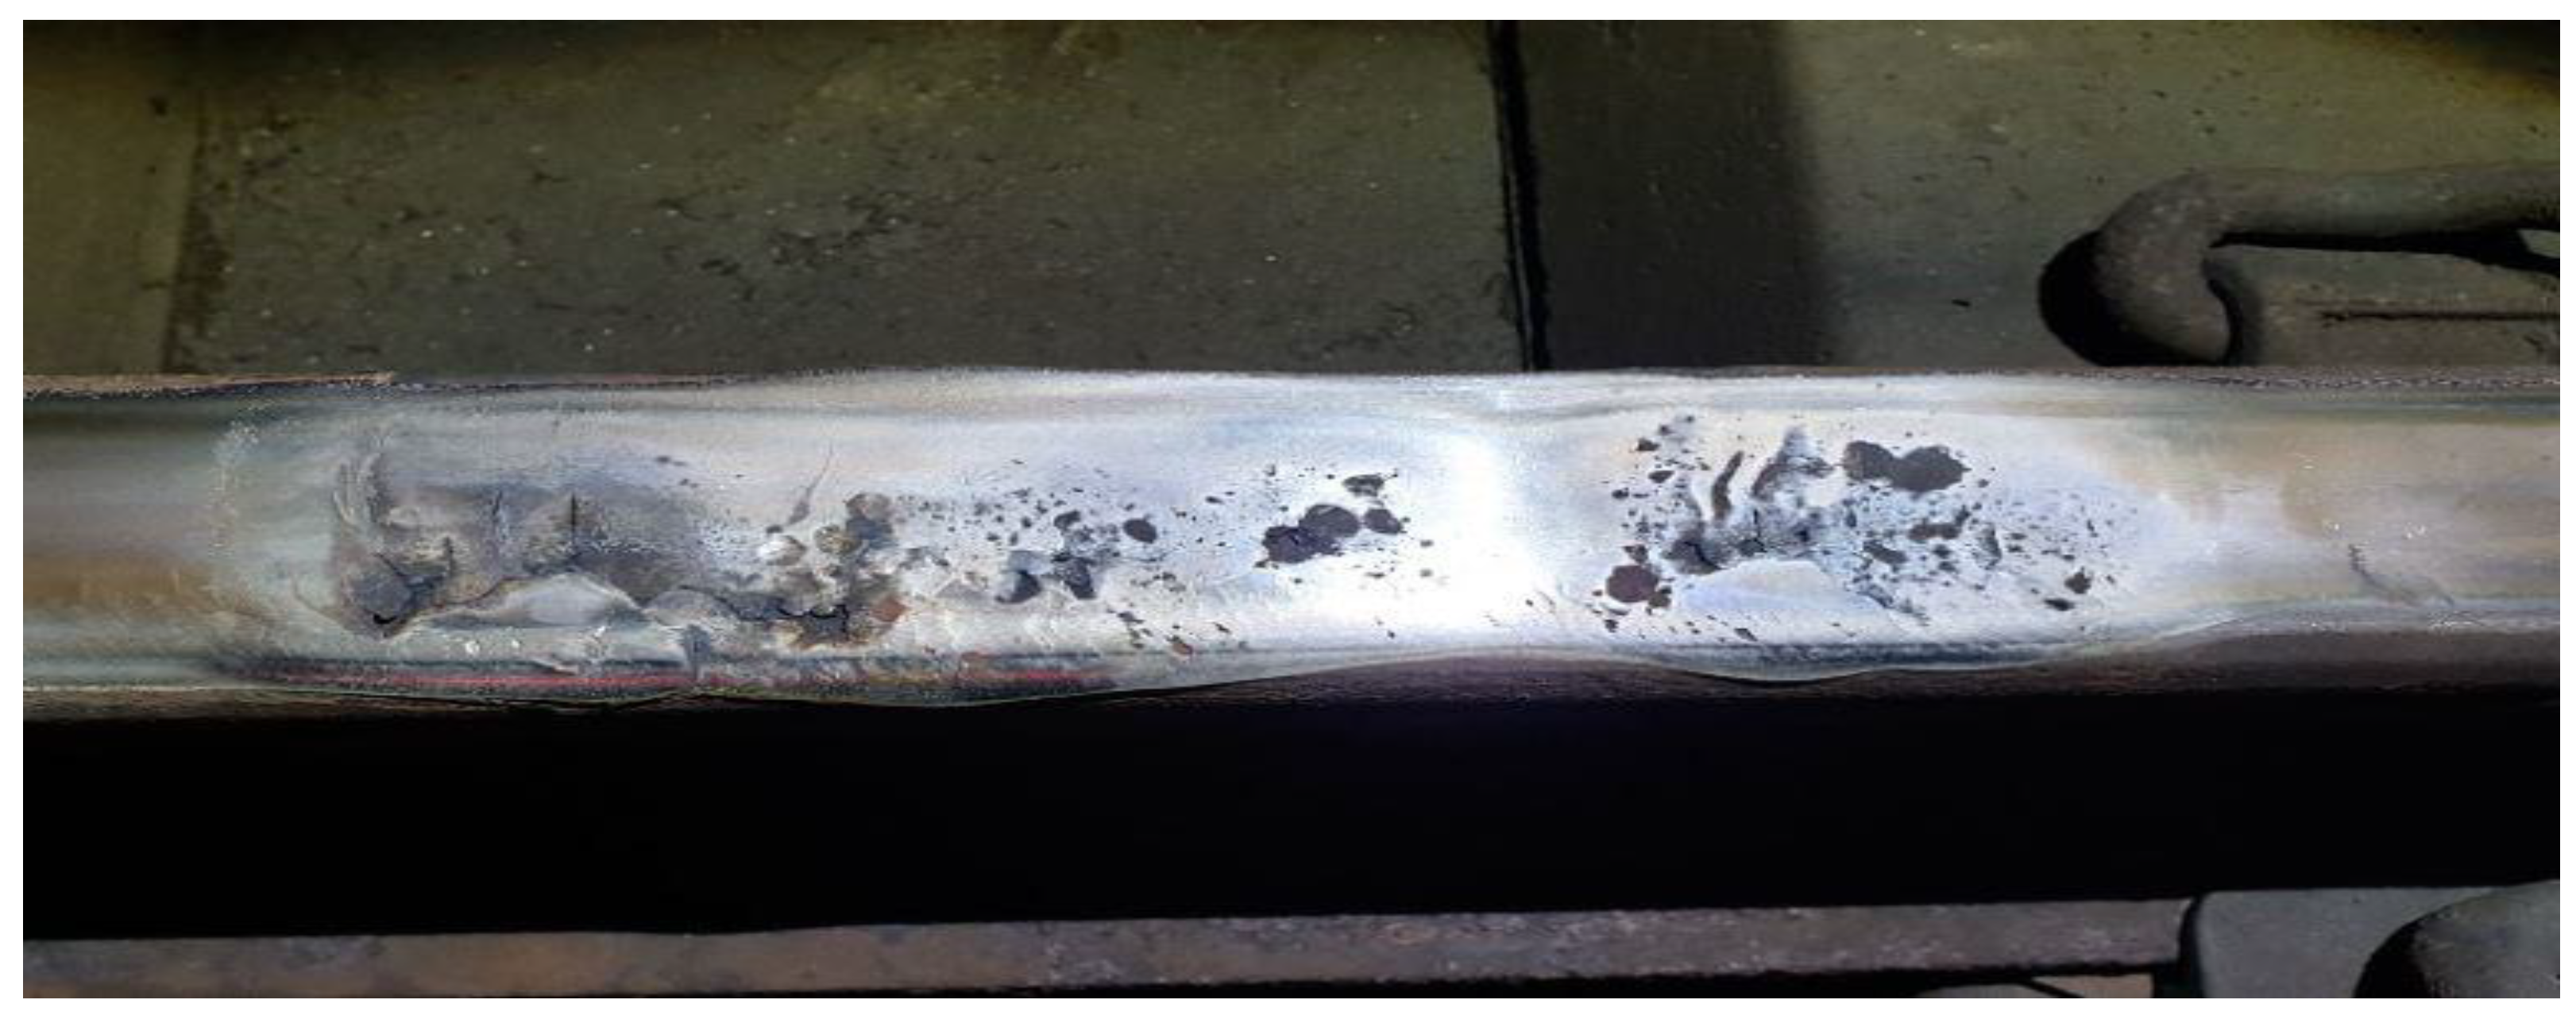
Meanwhile, seven different damage occurrences from the past seven years were observed on the closure panel. Rail wear was the primary type of damage. The status in terms of damage occurrence was determined based on the turnout numbers; these were 3, 2, and 2 for F8, F10, and F12, respectively, thereby indicating that more damage occurred in turnouts with shorter lengths. In the closure rail, as shown in Figure 5 and Figure 6, the main types of damage were head check, squat, and side wear, which are forms of rolling contact fatigue damage. In addition, wear and partial fracture also occurred on the crossing nose, which bears the highest level of repetitively applied impact loads among the turnout components, as shown in Figure 7.
Owing to the side wear of the closure rail facing the check rail, the space that allows the lateral movements of the wheel sets was secured. This caused the wheel flangeway to come into contact with the check rail. Therefore, abnormal wear occurred on the check rail, as shown in Figure 8a. The widening of the check rail flangeway caused lateral displacement and the rotation of the wheel set when the train was running, resulting in an unbalanced distribution of the rail load and an increase in damage to the check rail, check rail bolt, and the check rail bracket baseplate that supported the check rail. Under normal conditions, the check rail should not come into contact with the wheels. However, as shown in Figure 8b, if the gauge expands due to abnormal wear or the side wear of the closure rail, the wheel set is displaced by the same amount of side wear and the check rail comes into contact with the wheel flangeway. The check rail bracket baseplate then supports the entire load of the railway bogie, thus leading to loosening, deformation, breakage of the fastening bolts, and the fracture of the baseplate.
2.3. Analysis of Historical Maintenance Records for Turnout Systems
The damage quantities on the railway were categorized based on each major location of the turnout system. We analyzed the 10 years of historical maintenance records. As is shown in Figure 9, a total of 321 cases of damage occurred. The highest number of occurrences were observed on the crossing panel.
In the case of the switch panel, there were twice as many damage occurrences as on the closure rail due to the frequent operation of the switch toes and the smaller cross-section of the switch toes compared to those of the other rails.
A total of 46 damage cases occurred on the quantity for the closure panel, as shown in Figure 9. Of these damage cases, the main types were side wear and vertical wear. Although the horizontal alignment condition of the closure panel of a turnout system is a curve, the centrifugal force acting outward of the curve cannot be controlled owing to the absence of a cant. Therefore, although the turnout system limits the passing speed of the train, a lateral load is applied in the case of a closure rail inducing the train to a branch line. Therefore, the pattern of wear on the closure rail exhibited the same shape as that of a sharp curve.
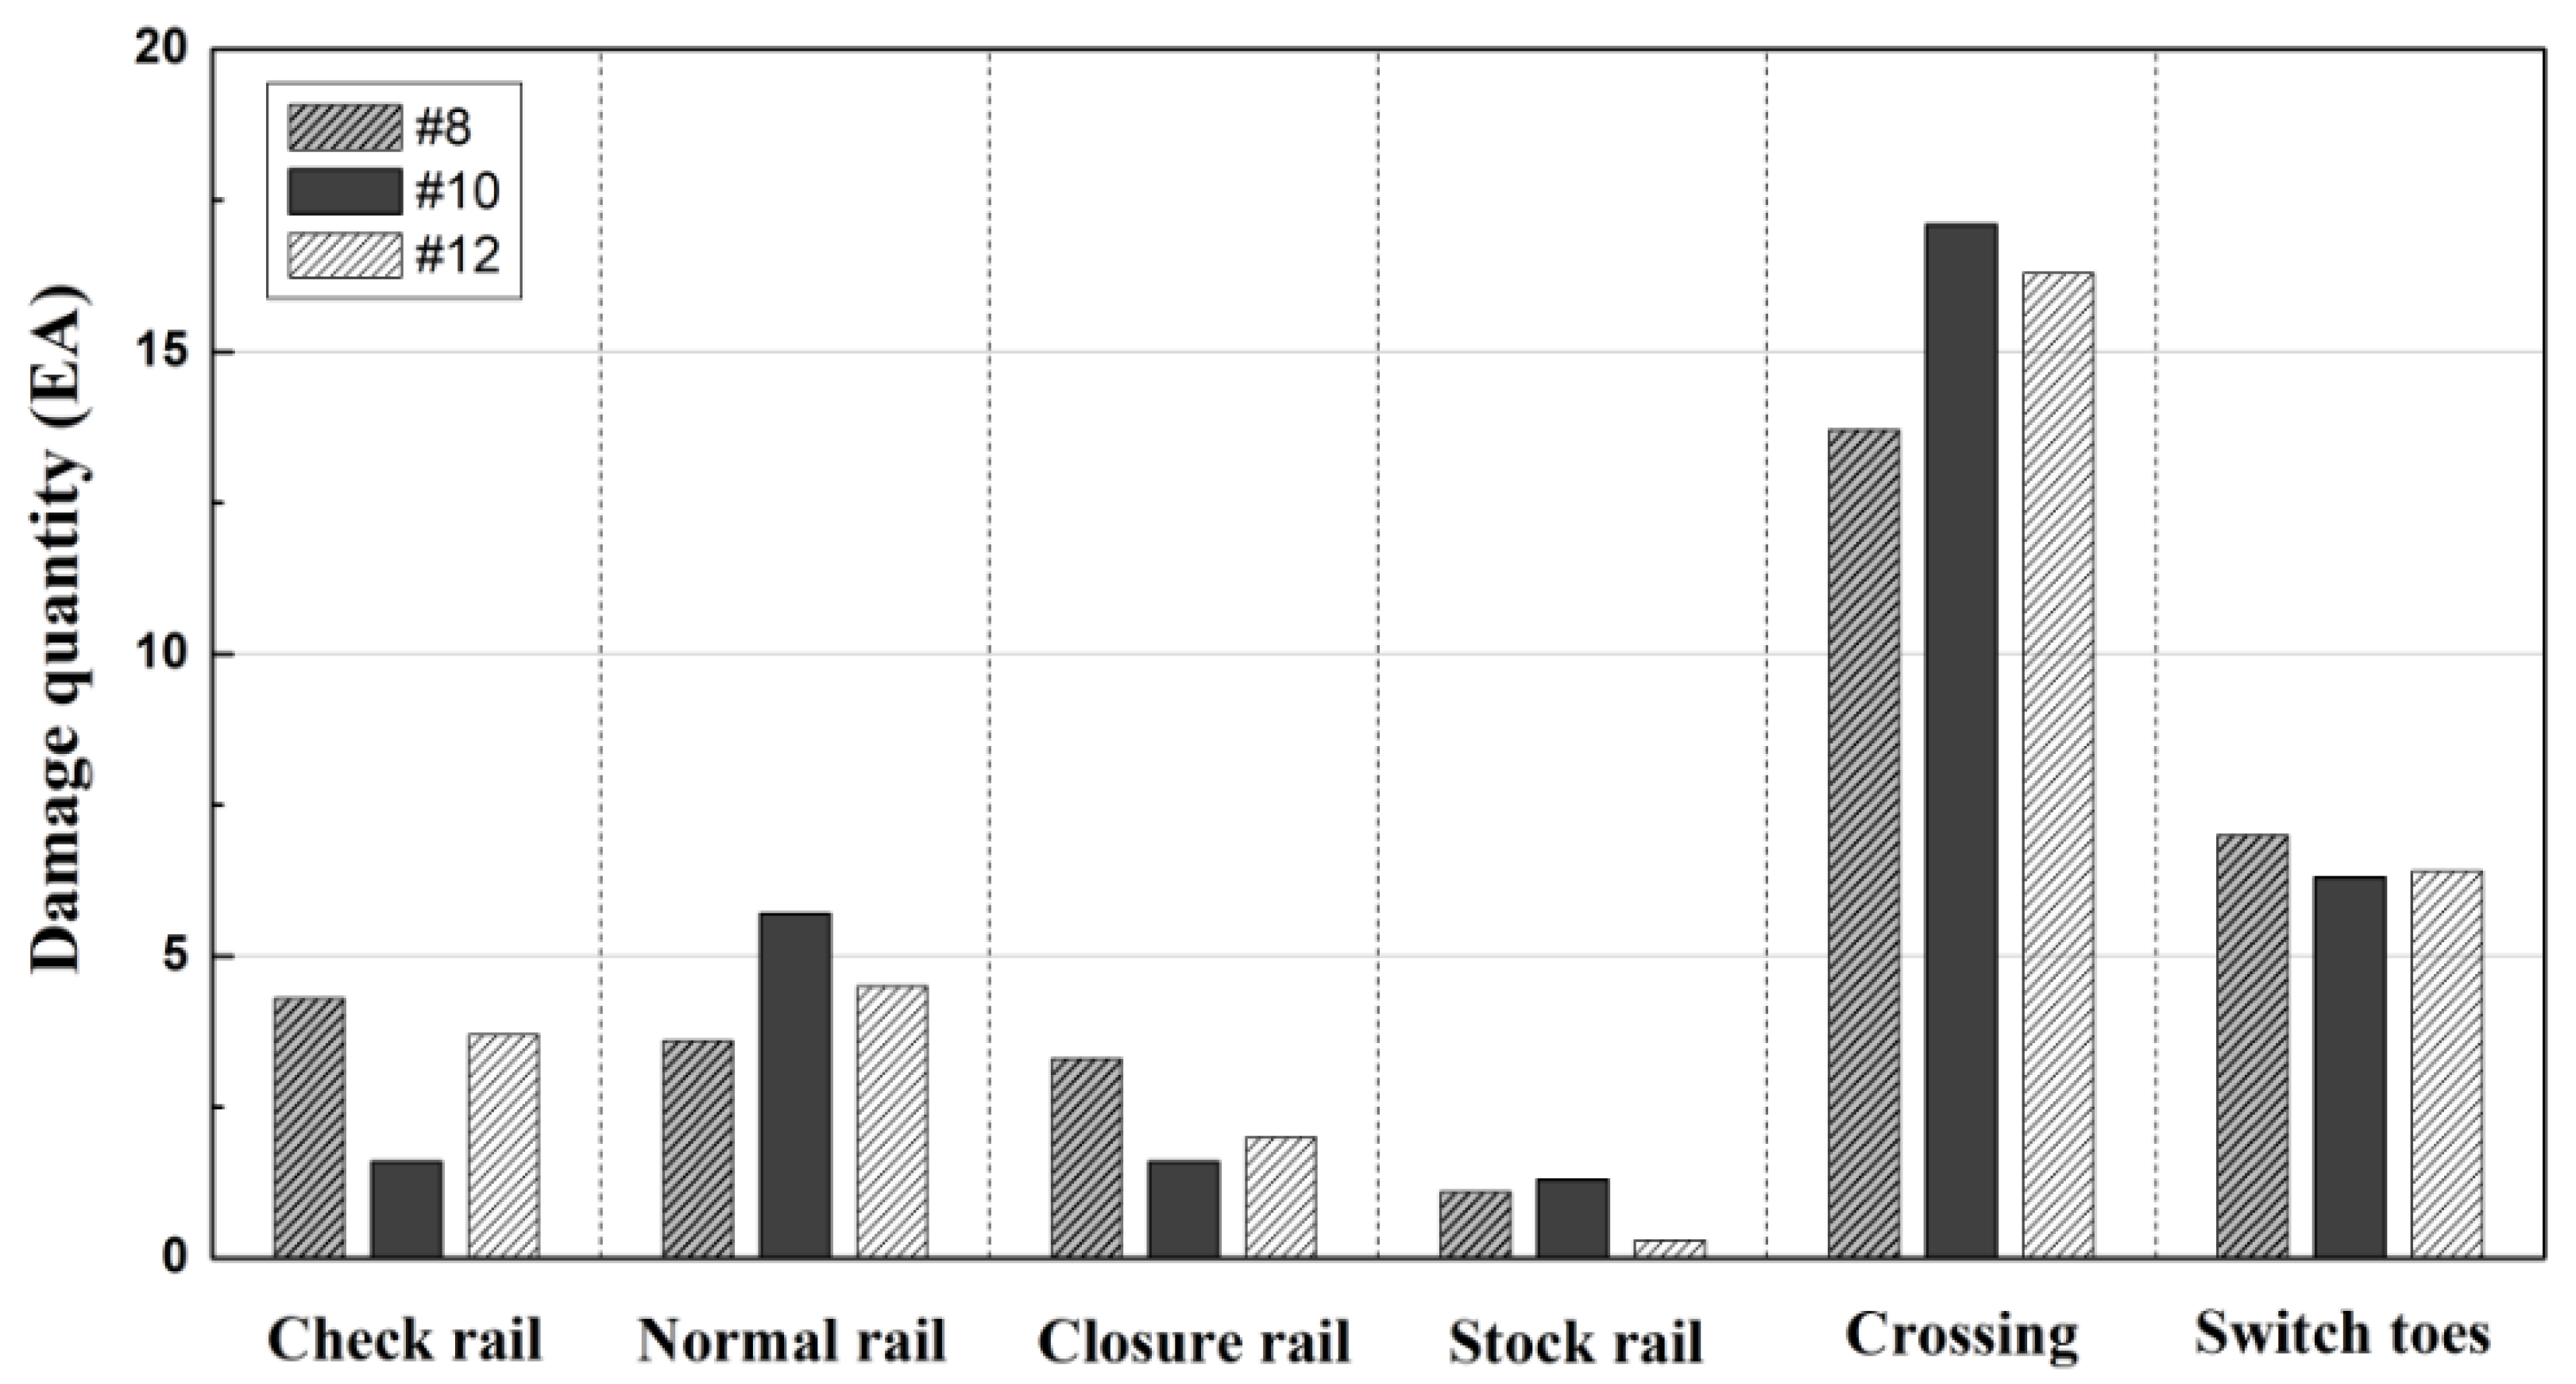
A total of 180 cases occurred on the quantity for the crossing panel, as shown in Figure 9, resulting in a larger damage quantity compared to that of the switch panel and closure panel. Based on the turnout number, 53, 81, and 46 cases of damage occurred for F8, F10, and F12, respectively. As in the case of the switch panel, these were attributed to the number of installations. For the crossing panel, replacement was performed mainly due to cracks and wear on the manganese steel crossing. The damage quantities were in the following order from highest to lowest: crossing, check rail, normal rail, and stock rail.
The overall ranking of the damage quantities on the rails, from highest to lowest, was: crossing rail, switch toes, normal rail, check rail, closure rail, and stock rail, as shown in Figure 10.
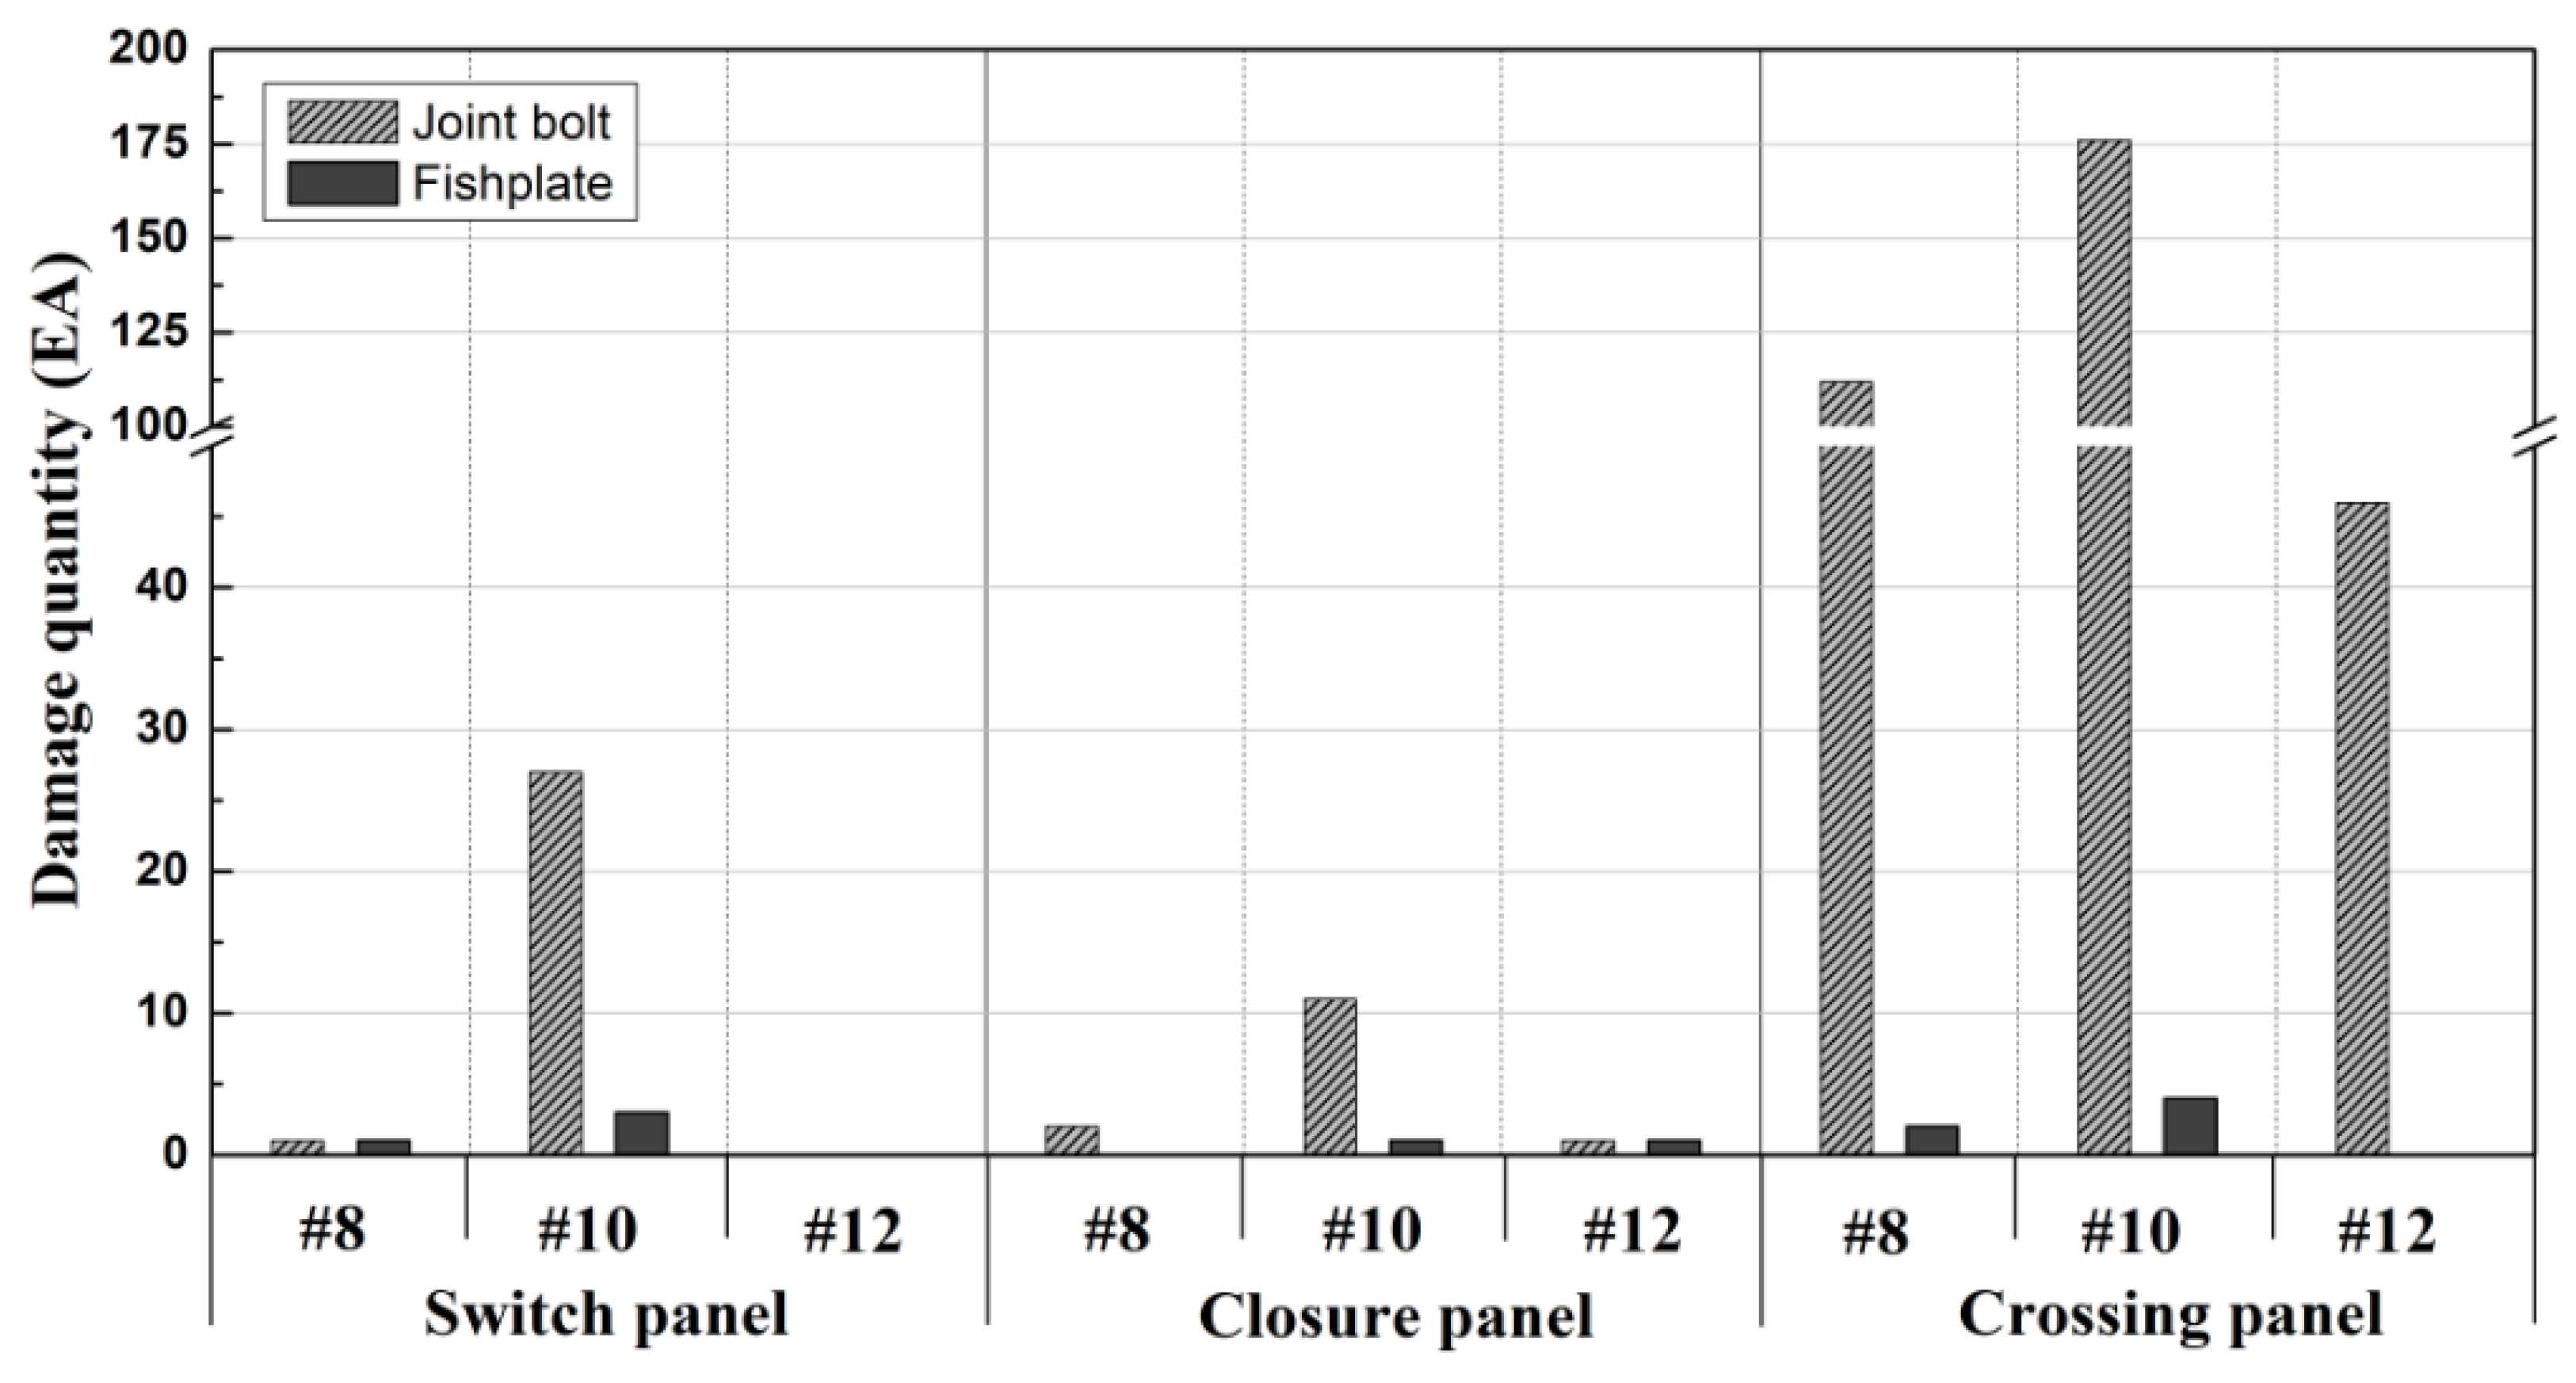
In the case of the rail joints, a total of 214 damage cases occurred at the F10 turnout, i.e., the turnout with the highest number of installations in the main line. The F10 turnout accounted for over 60% of the total damage quantity on the rail joints. Therefore, the damage quantity on the rail joints was proportional to the number of installations. Moreover, most of the damage occurred in the joint bolts. The results of the analysis on the damage quantity on the rail joints (fishplate and joint bolt) with respect to the main locations in the turnout system showed that the highest number of damage cases occurred on the crossing panel, as shown in Figure 11.
As shown in Figure 12, in the case of the baseplates, similar to the rail joints discussed previously, the damage on the F10 turnout accounted for approximately 60% of the total damage, thereby indicating that the damage quantity was proportional to the number of installations. In addition, similar to the case of the rail joints, the highest number of damage cases occurred on the baseplate of the crossing panel, whereas in the case of the F10 turnout, the damage to the check rail bracket baseplate of the crossing panel was significantly greater than that for other locations in the turnout system [18].
As shown in Figure 13, the damage quantity on the wooden sleepers was at its largest for the crossing panel, whereas no clear differences were observed in the damage quantity by the turnout number for the switch panel and closure panel.
As shown in Figure 14, the damage quantity for the fastening system was the highest for the crossing panel and the switch panel of the F10 turnout. Furthermore, among the different components, the manganese steel crossing of the crossing panel, which was subject to the largest impact on the turnout system, and the screw spike connecting the wooden sleeper had the largest damage quantities.
As shown in Figure 15, the damage quantity on the bolts was the largest for the switch panel and the crossing panel heel block bolts of the F10 turnout, which had the highest number of main-line installations. Furthermore, more damage occurred on the cross panel, which was subjected to the largest impact, as well as on the switch panel, which had the highest frequency of operation. Meanwhile, in the case of the crossing panel, damage also occurred on the bolts used for fixing the check rail.
3. Evaluation of Damage in Turnout System Using FMEA
3.1. Maintenance History Analysis of Major Turnout Components
The wooden sleeper turnout system installed on an urban railway comprises many components. However, because the turnout system is used for a long time, it is inevitably subject to failure.
FMEA, which is applied to reduce the overall failure in the system, is an analysis technique based on recorded data which includes all possible failure modes and failure effects for the wooden sleeper turnout. Until now, however, when a turnout failure occurred, a cause analysis was not performed on the failure; instead, the components were replaced based on the subjective judgment of the maintenance engineers. As a result, existing turnout components with service lives of over 20 years, which were subjected to a passing tonnage of up to approximately 500–600 million tons, undergo a recurrence of failure within 1–7 years after the completion of corrective measures such as replacement.
Therefore, in this study, an FMEA was performed based on reorganized maintenance records from 2009 to 2019. These records had been manually managed in the Seoul metro. The analysis of failure occurrences was performed on wooden sleeper turnout systems and based on the damage status for various individual components of the systems. The ranking of the damage occurrence frequency for turnout systems was, from highest to lowest, as follows: rails, joints, baseplates, sleepers, fastening system, and bolts.
3.2. Definitions of Items for AHP Analysis and Results of Survey
The damage risk factors for the wooden sleeper turnout systems of urban railways were classified into 7 categories (rail, rail joint, joint, baseplate, sleeper, fastening, and bolt) and 25 subcategories based on the existence or nonexistence of a history of maintenance and replacement. A survey was conducted among a group of experts, each with over 10 years of experience in railway maintenance.
- Survey item: Survey of risk priority for sleeper floating track (known as STEDEF) wooden sleeper turnout system;
- Participants: Experts with over 10 years of track maintenance experience in urban railway operating agencies;
- Period: 1–20 August 2020 (for 20 days);
- Method: A total of 15 copies of the questionnaire were distributed to 15 field management personnel through on-site visits, and 40 copies were distributed to 40 employees at head offices, business offices, and outside personnel. A total of 55 people were surveyed;
- Main characteristics of survey respondents: With regard to the number of years in service for the respondents: 60% of the selected experts had 25 to 30 years in service, 20% had between 20 and 25 years of experience, and 20% had between 10 and 20 years of experience.
The score distributions of occurrence, sensitivity, and detection for 66 turnout damage risk factors were each provided in a range of 1 to 5 points. Occurrence was defined as the likelihood of failure occurrence in the sleeper floating track (STEDEF) wooden sleeper turnout. The criteria for occurrence scores are presented in Table 1.
The descriptions of the level of sensitivity for each failure mode of the sleeper floating track (STEDEF) wooden sleeper turnout are presented in Table 2.
The impact represents the level of influence on related components and the turnout system when failure occurs in the sleeper floating track (STEDEF) wooden sleeper turnout. The impact score criteria are presented in Table 3.
For detection, we evaluated the level of difficulty in detecting damage on each turnout component. These components were divided into rail and non-rail components. The value of D was calculated based on the score given by categorization according to the methods of inspection and testing for the maintenance of the turnout system and the matters that required inspection by experts. Regarding the sensitivity calculation, importance refers to the degree of influence on the maintenance of the turnout system and was determined using the analytic hierarchy process (AHP) with the participation of 10 or more experts to ensure objective assessment.
The major rail components in terms of weight (i.e., significance) were in the following order from highest to lowest: crossing, switch toes, normal rail, check rail, wing rail, stock rail, and closure rail. The weights of the components of the rail joints were 40% for the fishplate and 60% for joint bolts because more damage occurred in the joint bolts than in the fishplates.
Considering the weight of each component of the fastening system, as components for the connection of rails and baseplates, the U-clip, screw spike, and coil spring clip were assigned equal weights based on the judgment of experts. In contrast, considering the weight of each component of the baseplate, the weights of the check rail bracket baseplate, crossing baseplate, and switch toes baseplate were the highest in a relative comparison. The weights by type of baseplate were in the following order from highest to lowest: check rail bracket baseplate, crossing baseplate, switch toes baseplate, closure rail baseplate, and sole plate.
The weights of the components of the sleeper were in the following order from highest to lowest: wooden tie and bearing tie. The weights by component of the bolts were 50% for the check rail bolts and 25% each for the heel block bolts and switching bolts.
3.3. Calculation of RPN by Turnout Component
Table 4 shows the damage ratios by turnout component according to the turnout system maintenance records data. The damage ratios for the different types of components were in the order from highest to lowest, as follows: rails, joints, bolts, wooden sleepers, baseplates, and the fastening system.
For occurrence, according to the results of historical record analysis on the turnout system, the range of values was calculated based on the frequency of damage occurrence on the component. As it was not possible to obtain all actual occurrences of damage, the results of on-site inspections of the urban railway wooden sleeper turnout were incorporated, and the range was classified based on the analyzed on-site inspection data values, as shown in Table 5. For approximately 0 occurrences, 1 point was assigned, followed by 2 points for 1–10%, 3 points for 10–20%, 4 points for 20–25%, and 5 points for 25% or more.
With regard to the occurrence (P) scores for the rails, the crossing (47.1%) had the largest damage quantity, scoring 5 points, followed by the switch toes (19.8%) and normal rail (13.9%) with 3 points each, followed by the check rail (9.6%), closure rail (6.9%), and stock rail (2.7%) with 2 points each. Conversely, with regard to the P scores of the non-rail components, the calculation results were 4 points for the joint bolt and heel block bolt, 3 points for the crossing baseplate and switching bolt, and 2 points for all other components. The components that could be improved in terms of their P score were the crossing rail, switch toes, joint bolt, heel block bolt, crossing baseplate, and switching bolt. Among these, the P scores for the four non-rail components were: 4 points for joint bolts and heel block bolts (20 ≤ occurrence < 25) and 3 points for crossing baseplate and switching bolt (10 ≤ occurrence < 20). The P scores of these components could be improved by reducing the occurrence of damage. Therefore, an effective method must be applied to increase the occurrence score.
For estimating the sensitivity (S), the quantity of damage occurrence was included in the calculation, and the value was obtained by applying the weights assigned according to the relative comparison of components, such as rails, by in-house maintenance experts. As the occurrence was reflected in the calculation, the range of the sensitivity calculation criteria needed to be increased. Therefore, the weight was applied to occurrence and the sensitivity score was calculated as presented in Table 6.
The sensitivity score was based on a numerical rating that indicated the effect of the operation of the train in the event of failure. The sensitivity rating was the highest at 46.96% and 37.41% for the crossing rail and switch toes, respectively; a sensitivity score of 5 points was assigned for each of these components. Conversely, the sensitivity scores of the other types of rails were all assigned 2 points.
The sensitivity scores of the non-rail components were calculated using the same method used for the rails. For the non-rail components, there was no component for which the sensitivity rating exceeded 30%; the components with the highest sensitivity scores were the joint bolts and wooden ties, each receiving a score of 4 points. The scores for the screw spikes and check rail bolts were 3 points each, whereas the scores for all other non-rail components were 2 points. The components for which the sensitivity could be improved were the crossing rail, switch toes, joint bolt, wooden tie, screw spike, and check rail bolt. Among these six components, for the four non-rail components, the S score of 4 points (20 ≤ sensitivity rating < 30) for the joint bolts and wooden ties could be improved to 3 points (10 ≤ sensitivity rating < 20) by reducing the damage quantity, which is a requirement relevant to the occurrence.
As shown in Table 7, the detection score was calculated as follows: 1 point for easy detection by visual inspection with a level of difficulty between 0–5%, and 2 and 3 points for a level of difficulty between 5–10% and 10–15%, respectively.
To calculate detection (D), the scores for visual inspection, chemical treatment, and the use of specialized equipment were indicated in the detection score for each occurrence of damage. The highest among the calculated scores was determined to be the final detection score. The detection scores for the rails were calculated to be 2 and 3 points for the check rails and the remaining five types of rails, including normal rails, respectively.
4. Classification into RPN Groups by Analysis of Risk Priority Number (RPN)
4.1. RPN Groups
To analyze and identify the cause of failure of each component for risk management via FMEA and quantify the scores of occurrence, sensitivity, and detection to demonstrate the necessity for group management by component, the risk priority number (RPN) was calculated as the product of occurrence, sensitivity, and detection, as shown in Figure 16. In Step 1, the failure frequency distribution, was calculated based on the probability number. Step 2 was to determine the sensitivity number, which represents the quantity according to the component by frequency. Step 3 involved the detection number, which is an evaluation and analysis of the data by function and cause of failure.
When selecting the RPN groups for each component, the results of the analysis of existing maintenance records data and survey results from the expert group were reflected in terms of weights. Table 8 shows the criteria for calculating the score for classification into RPN groups. Considering the criteria for scoring, the score for group C was set at 20 points, which was the minimum requirement, or to higher values. This group was set as the score group for the range within which the damage occurrence could be reduced by modifying and improving components to obtain efficiency in maintenance.
For group B, the score distribution range was set to 10–20 points, which is the range of scores for the planning of improvement measures. This scoring range represents the scores that could be advanced to group A by improving and modifying the components. Finally, RPN group A refers to the group of components that do not need immediate corrective actions for improvement and for which maintenance can be performed through routine inspection.
As shown in Table 9, the components that corresponded to group C, which had the highest priority for preventive maintenance, included the crossing, switch toes, joint bolt, and heel block bolt, with RPN scores between 24–75 points. Meanwhile, the components in group B included the normal rail, closure rail, stock rail, switching bolt, wooden tie, crossing baseplate, and check rail bolt, with RPN scores in the range of 12–18 points. Finally, group A comprised 12 components, including the check rails, with RPN scores between 2–8 points. Based on the efforts of the maintenance engineers in the inspections and improvements to reduce the failure occurrence of rails and bolts in RPN group C, in addition to the baseplate, wooden tie, and bolts in RPN group B, it was determined that groups B and C could be advanced to groups A and B.
4.2. Measures for Improvements to Higher-Level RPN Groups
As a result of the FMEA, the RPN group C can be advanced to group B by improving the failure occurrence of the joint and heel block bolt, excluding the rails among the turnout components, crossing rail, switch toes, and joint, and heel block bolts.
As a result of the RPN analysis, the crossing baseplate and switching bolt of group B could be improved to group A. However, the occurrence score was low in the case of the wooden tie; this makes it difficult to improve from this aspect. Furthermore, the analysis showed that there was an improvement effect only in the maintenance of the current state.
As shown in Figure 17, the improvement measures are as follows: implement the use of locknuts to prevent the loosening of bolts; adjust the baseplate size to secure the clamping force; and increase the quantity of screw spike connections. The analysis showed that when the clamping force of the baseplate is secured, the damage quantity of the baseplates and screw spikes can be reduced.
Additionally, the performance improvement of the baseplate not only indicates the advancement of the RPN group of the baseplate, but also reduces damage to the rails, wooden ties, screw spikes, and e-clips, which are other components that may be affected by the performance improvement of the baseplate. Therefore, it is expected that the occurrence score can be reduced. By improving the performance of the baseplate, it is possible to secure the clamping force and bearing capacity for fixing the positions of the wooden sleeper, baseplates, and rails. Furthermore, as the area of the baseplate increases, the load applied on the wooden sleeper is distributed. As a result, the performance improvement of the baseplate can decrease the occurrence of failures by reducing the number of damages of the crossing baseplate, wooden sleeper, and fastening system.
Considering the effect of advancement from one RPN group to the next, the final RPN group can be advanced to the B group by improving the occurrence and sensitivity, as shown in Table 10.
As is shown in Table 10, the improvement of the baseplate can affect the components of the wooden sleeper turnout system, such as the baseplates, wooden sleeper, and the fastening system, such as the screw spike and rails, which can increase the overall fastening force. Therefore, the components that can be upgraded from Group C to Group B can be upgraded by over 30% in five components (among the seven components) excluding rails. In existing urban railways, maintenance is typically concentrated on the rails. However, in this study, components with potential risks were classified into groups based on the FMEA analysis, and a plan to improve turnout maintenance was proposed by applying risk groups for damage reduction.
5. Conclusions
This study applied the FMEA technique to analyze 10 years of maintenance records to classify the failure modes (types of damage) and analyzed the maintenance plans and measures for the wooden sleeper turnout systems of sleeper floating tracks (STEDEF) in urban railways. Furthermore, we analyzed the causes and frequencies of damage.
Based on the maintenance records, the damage statuses of various components that constitute an urban railway wooden sleeper turnout system were quantified for analysis. Additionally, an AHP analysis was performed to calculate the importance and weight of each turnout component by surveying an expert group. By calculating the RPN score via the analysis of occurrence, sensitivity, and detectability based on the FMEA, the RPN scores for the rail components were determined to be in the following order from highest to lowest: crossing, switch toes, and normal rails. Meanwhile, for non-rail components, the scores were determined to be in the following order from highest to lowest: joint bolt, heel block bolt, crossing baseplate, and switching bolt.
Based on the RPN scores, the turnout components were classified into RPN groups, and maintenance plans were proposed for the turnout components accordingly. The analysis showed that the RPN groups for the turnout components derived in this study were similar to the on-site maintenance data and expert survey results (importance) in terms of the score range for each RPN group.
Regarding the occurrence scores, the crossing and switch toes exhibited the highest sensitivity scores. Conversely, for non-rail components, the sensitivity scores were in the following order (from highest to lowest): joint bolt, wooden tie, screw spike, and check rail bolt. These components had a relatively large impact across the entire turnout system. Detection values were high for all rails except the check rail, whereas for the non-rail components, high D values were derived for the bolts and baseplates.
As a result of the RPN analysis, rails were excluded because the improvement in their occurrence score was insignificant, whereas components for which the occurrence score could be reduced were selected among non-rail components. We selected five components, namely the switching bolt, joint bolt, heel block bolt, crossing baseplate, and wooden tie. The results showed that by improving the design of the cross-section shapes and the improvements in the materials, the components can be advanced to better RPN groups, thereby reducing failure occurrence.
Among the five components, the baseplate was selected as the component expected to affect the reduction of damage occurrence and sensitivity scores of other related components based on performance improvement. Therefore, based on component advancements in low-level RPN groups, inspection cycles can be implemented by maintenance engineers for components that require more careful inspection. Based on the FMEA of this study, the efficiency of maintenance can be increased by inspection according to the priority inspection sequence. In addition, it is possible to minimize future turnout damage and minimize maintenance costs.
Author Contributions
Conceptualization, J.-Y.C. and K.-S.H.; methodology, J.-Y.C. and J.-S.C.; formal analysis, J.-Y.C., K.-S.H. and J.-S.C.; data curation, K.-S.H., J.-S.C. and S.-H.K.; writing—original draft preparation, J.-Y.C. and S.-H.K.; writing—review and editing, S.-H.K. All authors have read and agreed to the published version of the manuscript.
Funding
This research received no external funding.
Institutional Review Board Statement
Not applicable.
Informed Consent Statement
Not applicable.
Data Availability Statement
Not applicable.
Conflicts of Interest
The authors declare no conflict of interest.
References
- Kim, T.G. Running Safety Depending on the Variations of Cross-Sectional Shape of F10 Turnout. Master’s Thesis, Seoul National University of Science and Technology, Seoul, Republic of Korea, February 2011. [Google Scholar]
- Lim, E.T.; Koo, J.; Kwon, Y.G. FMEA application and development of emergency response system standards for risk assessment and improvement of accident response of one-man-operation train driver in Seoul metro. J. Korean Soc. Railw. 2021, 24, 56–71. [Google Scholar] [CrossRef]
- Choi, J.J.; Lim, I.S.; Koo, I.S.; Park, S.J.; Kim, T.S. Application of the combined techniques for reliability improvement on machine design process: Case study. J. Appl. Reliab. 2014, 14, 71–80. [Google Scholar]
- Youn, J.S. Analysis the Railway Accident Failure through FMEA Technique and Present the Priority Safety Management Items (About Derailment Caused by Track Defect). Master’s Thesis, Seoul National University of Science and Technology, Seoul, Republic of Korea, February 2014. [Google Scholar]
- Shirvani, F.; Scott, W.; Kennedy, G.A.L.; Campbell, A.P. Enhancement of FMEA risk assessment with SysML. Aust. J. Multi-Discip. Eng. 2019, 15, 52–61. [Google Scholar] [CrossRef]
- Issad, M.; Kloul, L.; Rauzy, A. A scenario-based FMEA method and its evaluation in a railway context. In Proceedings of the Annual Symposium on Reliability and Maintainability (RAMS), Orlando, FL, USA, 23–26 January 2017. [Google Scholar]
- Sitarz, M.; Chruzik, K.; Wachnik, R. Application of RAMS and FMEA methods in safety management system of railway transport. J. KONBiN 2012, 4, 149–160. [Google Scholar] [CrossRef] [Green Version]
- Wang, J.; Cui, Z.X.; Li, S.D.; Yang, T.; Cheng, H.Y.; Na, R.S. Reliability analysis of ballast cleaning device based on fuzzy FTA and FEMA. IOP Conf. Ser. Mater. Sci. Eng. 2021, 1043, 052042. [Google Scholar] [CrossRef]
- Macura, D.; Laketić, M.; Pamučar, D.; Marinković, D. Risk analysis model with interval type 2- fuzzy FMEA-case study of railway infrastructure projects in the republic of Serbia. Acta Polytech. Hung. 2022, 19, 103–118. [Google Scholar] [CrossRef]
- Fu, Y.; Qin, Y.; Wang, W.; Liu, X.; Jia, L. An extended FMEA model based on cumulative prospect theory and type-2 intuitionistic fuzzy VIKOR for the railway train risk prioritization. Entropy 2020, 22, 1418. [Google Scholar] [CrossRef] [PubMed]
- Márquez, F.P.G.; Schmid, F.; Collado, J.C. A reliability centered approach to remote condition monitoring. A railway points case study. Reliab. Eng. Syst. Saf. 2003, 80, 33–40. [Google Scholar] [CrossRef]
- Szkoda, M.; Kaczor, G. Application of FMEA analysis to assess the safety of rail vehicles. In Proceedings of the EURO-ZEL 2015 23rd International Symposium, Žilina, Slovakia, 2–3 June 2015. [Google Scholar]
- Park, B.N.; Joo, H.J.; Lee, C.H.; Lim, S.S. A study on FMEA for railway vehicle. In Proceedings of the 2009 Spring Conference & Annual Meeting of the Korean Society for Railway, Gyeongju-si, Republic of Korea, 21–23 May 2009. [Google Scholar]
- Matusevych, O.; Sychenko, V.; Białoń, A. Continuous improvement of technical servicing and repair system of railway substation on the basis of FMEA methodology. TTS Rail Transp. Technol. 2016, 1, 75–79. [Google Scholar]
- Szmel, D.; Wawrzyniak, D. Application of FMEA method in railway signaling projects. J. KONBiN 2017, 42, 93–101. [Google Scholar] [CrossRef] [Green Version]
- Huang, W.; Li, Y.; Kou, X.; Wang, W.; Xu, Y. Using a FMEA-TIFIAD approach to identify the risk of railway dangerous goods transportation system. Group Decis. Negot. 2021, 30, 63–95. [Google Scholar] [CrossRef]
- Smoczyński, P.; Kadziński, A. Introduction to the risk management in the maintenance of railway tracks. J. Mech. Transp. Eng. 2016, 68, 65–80. [Google Scholar] [CrossRef]
- Han, K.S. A Study on Maintenance of Turnout System Using FMEA Method. Ph.D. Thesis, Dongyang University, Yeongju-si, Republic of Korea, February 2021. [Google Scholar]
Figure 1.
Various components of the turnout system: (a) front overview of turnout system and (b) components of the crossing panel.
Figure 1.
Various components of the turnout system: (a) front overview of turnout system and (b) components of the crossing panel.

Figure 2.
Turnout system components.

Figure 3.
Types of turnout: (a) crossover; (b) double junction; and (c) scissors.

Figure 4.
Types of rail damage in a switch panel: (a) non-optimal contact and rolling contact fatigue damage; (b) local damage of switch toes (1); and (c) local damage of switch toes (2).
Figure 4.
Types of rail damage in a switch panel: (a) non-optimal contact and rolling contact fatigue damage; (b) local damage of switch toes (1); and (c) local damage of switch toes (2).

Figure 5.
Head check.

Figure 6.
Squat.

Figure 7.
Partial fracture of the nose.

Figure 8.
Wear in check rail and closure rail of turnout system: (a) check rail wear and (b) closure rail side wear.
Figure 8.
Wear in check rail and closure rail of turnout system: (a) check rail wear and (b) closure rail side wear.

Figure 9.
Overview of damage status for main positions in the railway.

Figure 10.
Ranking of damage quantities by rail type.

Figure 11.
Damage status of rail joints.

Figure 12.
Damage status of baseplates.

Figure 13.
Damage status of wooden sleepers.

Figure 14.
Damage status of fastening system.

Figure 15.
Damage status of bolts.

Figure 16.
FMEA cycle.

Figure 17.
Improvement in baseplate design: (a) before improvement of the baseplate and (b) after improvement of the baseplate.
Figure 17.
Improvement in baseplate design: (a) before improvement of the baseplate and (b) after improvement of the baseplate.


Table 1.
Occurrence criteria.
| Item | Likelihood of Failure Occurrence | Range of Frequency | Score |
|---|---|---|---|
| Very High | Inevitable and certain occurrence of failure | ≥25 | 5 |
| High | High likelihood of failure occurrence | 20 ≤ n < 25 | 4 |
| Medium | Medium-level likelihood of failure occurrence | 15 ≤ n < 20 | 3 |
| Low | Low likelihood of failure occurrence | 10 ≤ n < 15 | 2 |
| Very Low | Almost no likelihood of failure occurrence | 0 < 10 | 1 |
Table 2.
Sensitivity criteria.
| Item | Severity of Damage Impact | Score |
|---|---|---|
| Very High | Failure of turnout will lead to devastating accidents with loss of human life. | 5 |
| High | Failure of turnout will lead to large-scale accidents. | 4 |
| Medium | Failure of turnout will lead to medium-scale accidents. | 3 |
| Low | Failure of turnout will lead to small-scale accidents. | 2 |
| Very Low | Failure of turnout will lead to microscale accidents. | 1 |
Table 3.
Impact score criteria.
| Item | Level of Influence on Related Components and Turnout System | Score |
|---|---|---|
| Very High | Train service cannot run unless problem is resolved | 5 |
| High | High impact on turnout system, including related components | 4 |
| Medium | Medium-level impact on turnout system, including related components | 3 |
| Low | Low impact on turnout system, including related components | 2 |
| Very Low | No impact on turnout system, including related components, even when this problem actually occurs | 1 |
Table 4.
Ratios of damage by component.
| Components | Damage Quantity (EA) | Damage Ratio (%) | Ranking |
|---|---|---|---|
| Rails | 410 | 67.84 | 1 |
| Joints | 107 | 17.76 | 2 |
| Bolts | 51 | 8.51 | 3 |
| Wooden sleepers | 21 | 3.41 | 4 |
| Baseplates | 10 | 1.61 | 5 |
| Fastening system | 5 | 0.87 | 6 |
Table 5.
Occurrence (P) score estimation criteria.
| Score | Meaning | Range (%) |
|---|---|---|
| 1 | Almost no damage occurrence | occurrence < 1 |
| 2 | Low likelihood of damage occurrence | 1 < occurrence < 10 |
| 3 | Medium-level likelihood of damage occurrence | 10 ≤ occurrence < 20 |
| 4 | High likelihood of damage occurrence | 20 ≤ occurrence < 25 |
| 5 | Damage occurrence | 25 ≤ occurrence |
Table 6.
Sensitivity score estimation criteria.
| Score | Meaning | Range (%) |
|---|---|---|
| 1 | No impact | Sensitivity ratings < 0 |
| 2 | No immediate impact; low long-term impact | 0 < Sensitivity ratings < 10 |
| 3 | Some impact on turnout system; medium | 10 ≤ Sensitivity ratings < 20 |
| 4 | Loss of main functions; high | 20 ≤ Sensitivity ratings < 30 |
| 5 | Unsafe operation; high likelihood of human injury | 30 ≤ Sensitivity ratings |
Table 7.
Detection score estimation criteria.
| Score | Meaning | Range (%) |
|---|---|---|
| 1 | Distribution of numerical scores of detection methods such as visual inspection Low | 0 < Level of difficulty < 5 |
| 2 | Medium | 5 ≤ Level of Difficulty < 10 |
| 3 | High | 10 ≤ Level of Difficulty |
Table 8.
Classification of RPN groups.
| Category | C Group | B Group | A Group |
|---|---|---|---|
| Score range | 20 ≤ RPN | 10 ≤ RPN < 20 | 0 < RPN < 10 |
| Maintenance | Immediate corrective actions for improvement | Planning for improvement measures | Routine inspection |
Table 9.
Overview of RPN groups based on the types of turnout components.
| Description | Probability (P) | Sensitivity (S) | Detection (D) | RPN Score | RPN Group |
|---|---|---|---|---|---|
| Crossing | 5 | 5 | 3 | 75 | C |
| Switch toes | 3 | 5 | 3 | 45 | C |
| Joint bolt | 4 | 4 | 3 | 48 | C |
| Heel block bolt | 4 | 3 | 2 | 24 | C |
| Normal rail | 3 | 2 | 3 | 18 | B |
| Switching bolt | 3 | 2 | 3 | 18 | B |
| Wooden tie | 2 | 4 | 2 | 16 | B |
| Closure rail | 2 | 2 | 3 | 12 | B |
| Stock rail | 2 | 2 | 3 | 12 | B |
| Crossing baseplate | 3 | 2 | 2 | 12 | B |
| Check bolt | 2 | 2 | 3 | 12 | B |
| Check rail | 2 | 2 | 2 | 8 | A |
| Check baseplate | 2 | 2 | 2 | 8 | A |
| Baseplate | 2 | 2 | 2 | 8 | A |
| Screw spike | 1 | 3 | 2 | 6 | A |
| Closure joint | 2 | 2 | 1 | 4 | A |
| Normal joint | 2 | 2 | 1 | 4 | A |
| Insulation joint | 2 | 2 | 1 | 4 | A |
| Closure rail baseplate | 1 | 2 | 2 | 4 | A |
| Switch toes baseplate | 1 | 2 | 2 | 4 | A |
| Bearing tie | 2 | 2 | 1 | 4 | A |
| Crossing joint | 1 | 2 | 1 | 2 | A |
| U clip | 1 | 2 | 1 | 2 | A |
| Coil spring | 1 | 2 | 1 | 2 | A |
Table 10.
Effects of improvement on damage occurrence and sensitivity following performance improvements of a specific components.
Table 10.
Effects of improvement on damage occurrence and sensitivity following performance improvements of a specific components.
| Description | Probability (P) | Sensitivity (S) | Detection (D) | RPN | Group |
|---|---|---|---|---|---|
| Score before improvement | 4 | 4 | 2 | 32 | C |
| Score after improvement | 3 | 3 | 2 | 18 | B |
Disclaimer/Publisher’s Note: The statements, opinions and data contained in all publications are solely those of the individual author(s) and contributor(s) and not of MDPI and/or the editor(s). MDPI and/or the editor(s) disclaim responsibility for any injury to people or property resulting from any ideas, methods, instructions or products referred to in the content. |
© 2023 by the authors. Licensee MDPI, Basel, Switzerland. This article is an open access article distributed under the terms and conditions of the Creative Commons Attribution (CC BY) license (https://creativecommons.org/licenses/by/4.0/).
Share and Cite
MDPI and ACS Style
Choi, J.-Y.; Kim, S.-H.; Han, K.-S.; Chung, J.-S. Application of Failure Mode Effects Analysis for Maintenance of Turnout System on Serviced Urban Rapid Transit. Appl. Sci. 2023, 13, 2978. https://doi.org/10.3390/app13052978
AMA Style
Choi J-Y, Kim S-H, Han K-S, Chung J-S. Application of Failure Mode Effects Analysis for Maintenance of Turnout System on Serviced Urban Rapid Transit. Applied Sciences. 2023; 13(5):2978. https://doi.org/10.3390/app13052978
Chicago/Turabian StyleChoi, Jung-Youl, Sun-Hee Kim, Kyung-Sung Han, and Jee-Seung Chung. 2023. "Application of Failure Mode Effects Analysis for Maintenance of Turnout System on Serviced Urban Rapid Transit" Applied Sciences 13, no. 5: 2978. https://doi.org/10.3390/app13052978
Note that from the first issue of 2016, this journal uses article numbers instead of page numbers. See further details here.